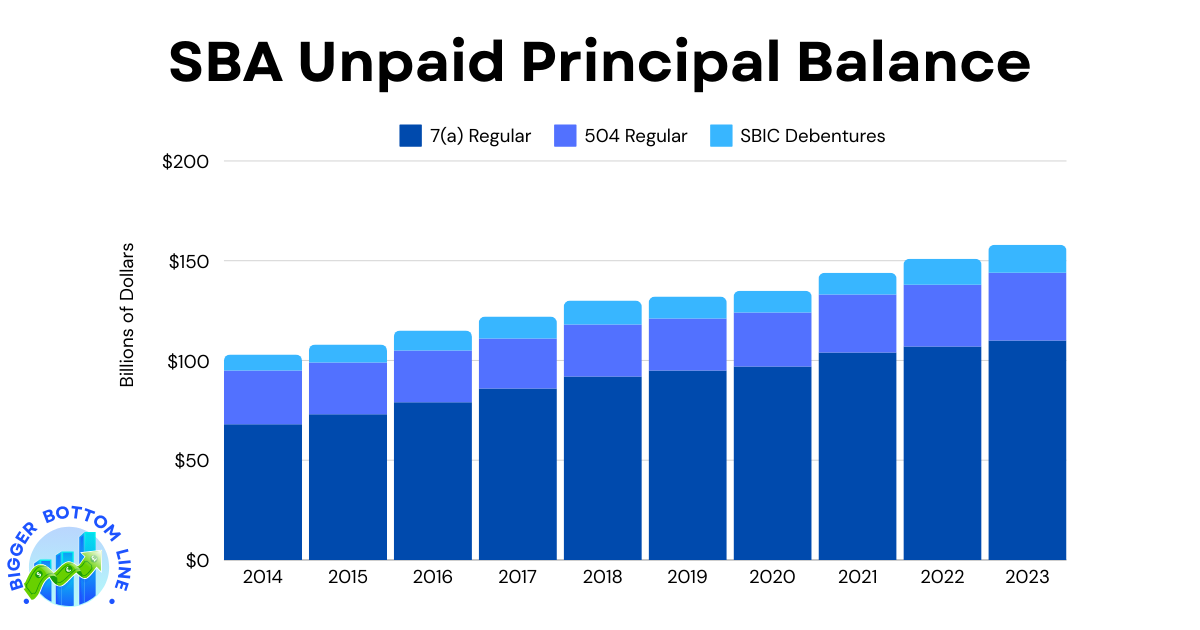
The Small Business Administration’s (SBA) loan portfolio has shown consistent growth over the past decade, with the most significant expansion occurring in the 7(a) Regular program. From 2014 to 2023, the 7(a) program’s unpaid principal balance grew substantially from $68 billion to $110 billion, representing a 62% increase. The 504 Regular program maintained relatively stable levels between $25-27 billion from 2014 to 2020, before showing notable growth in recent years, reaching $34 billion by 2023. The SBIC Debentures program, while smaller in scale, has demonstrated steady growth from $8 billion in 2014 to $14 billion in 2023.
The data reveals the increasing importance of SBA lending programs in supporting small businesses, with total combined UPB across all three programs growing from $103 billion in 2014 to $158 billion in 2023. This growth has been particularly pronounced since 2020, possibly reflecting the increased demand for small business financing during and after the COVID-19 pandemic. The 7(a) program remains the dominant lending vehicle, consistently accounting for over 60% of the total UPB across all three programs.

