The Art of Business Growth: Expert Funding Solutions for Your Business

Do you need assistance getting financing for your business? Contact us for help! We can assist from advising which lenders to submit to all the way through to developing & submitting a complete business loan package and anything in between. Contact us now for a free evaluation.

Business Podcasts: Listen to audio summaries of our Ultimate Guide book series. Be sure to come back and read the full guides.

JOIN our private BUSINESS RESOURCE VAULT!
Access 21+ Business Books!
Get weekly LOAN opportunities!

Infographic: Top States for SBA Loans

.stk-6faae37 {border-top-left-radius:8px !important;border-top-right-radius:8px !important;border-bottom-right-radius:8px !important;border-bottom-left-radius:8px !important;overflow:hidden !important;border-style:dashed !important;border-top-width:1px !important;border-right-width:1px !important;border-bottom-width:1px !important;border-left-width:1px !important;}
Bar chart showing the top 10 states for SBA loans in 2023. California leads with 7,292 loans, followed by Florida (5,238), Texas (4,365), New York (4,294), Ohio (3,761), Michigan (2,628), New Jersey (2,336), Illinois (2,253), Pennsylvania (2,162), and Georgia (1,875).

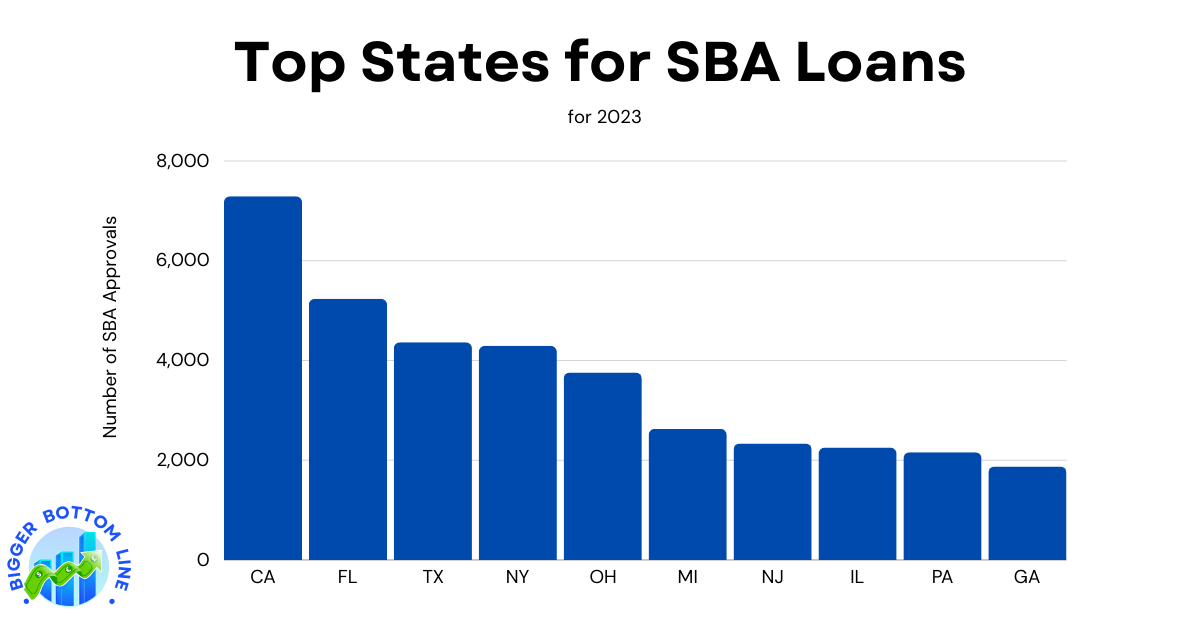
The Small Business Administration (SBA) loan data for 2023 reveals significant regional variations in small business lending across the United States. California dramatically leads the nation with 7,292 SBA loans, demonstrating its robust small business ecosystem and entrepreneurial environment. This is nearly 40% more than the second-ranking state, Florida, which recorded 5,238 loans.

The data shows a clear concentration of SBA lending activity in states with large populations and major economic centers. The top four states – California, Florida, Texas, and New York – collectively account for more than 21,000 loans, or approximately 47% of the total loans among the top 10 states. Notably, while Midwestern states like Ohio and Michigan rank in the top 10, they show significantly lower loan quantities compared to their coastal counterparts, with Ohio recording 3,761 loans and Michigan at 2,628. This distribution pattern likely reflects both population differences and varying levels of small business activity across regions.