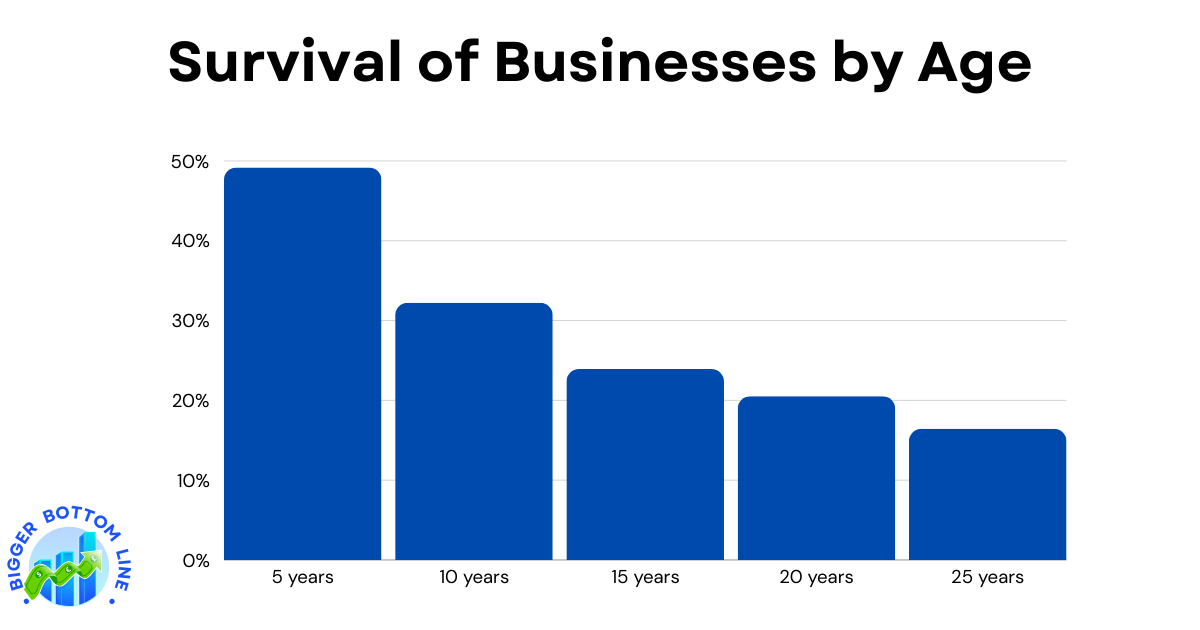
The data presents a sobering look at business longevity, showing how the percentage of surviving businesses decreases significantly over time. While nearly half (49%) of all businesses manage to survive their first five years, this number drops dramatically to just under one-third (32%) by the ten-year mark. The decline continues as businesses age, with only 24% making it to 15 years and 21% reaching their 20th anniversary. By the 25-year mark, just 16% of businesses remain operational, highlighting the significant challenges of maintaining a successful business over the long term. This pattern underscores the importance of adaptability and resilience in business management, as the majority of enterprises will face closure or acquisition within their first quarter-century of operation.

