
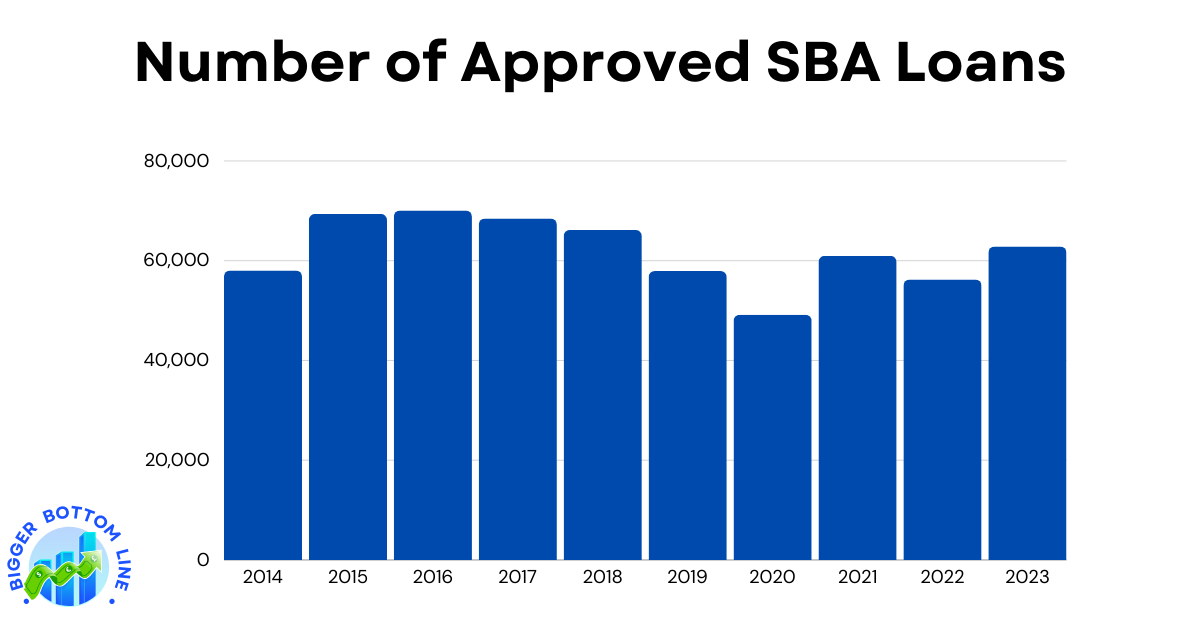
The Small Business Administration (SBA) loan approval data from 2014 to 2023 reveals interesting patterns in small business lending over the past decade. The number of approved loans showed steady growth in the early years, increasing from 58,041 in 2014 to reach a peak of 70,082 approvals in 2016. However, following this peak, the numbers began a gradual decline through the latter half of the 2010s.
The most notable downturn occurred in 2020, when loan approvals dropped significantly to 49,165, likely influenced by the COVID-19 pandemic and economic uncertainty. The following years showed signs of recovery, with approvals rebounding to 60,967 in 2021 and maintaining relatively stable numbers through 2023, which saw 62,863 approvals. This recent stabilization suggests a return to more normal lending patterns, though not quite reaching the peak levels observed in the mid-2010s.