
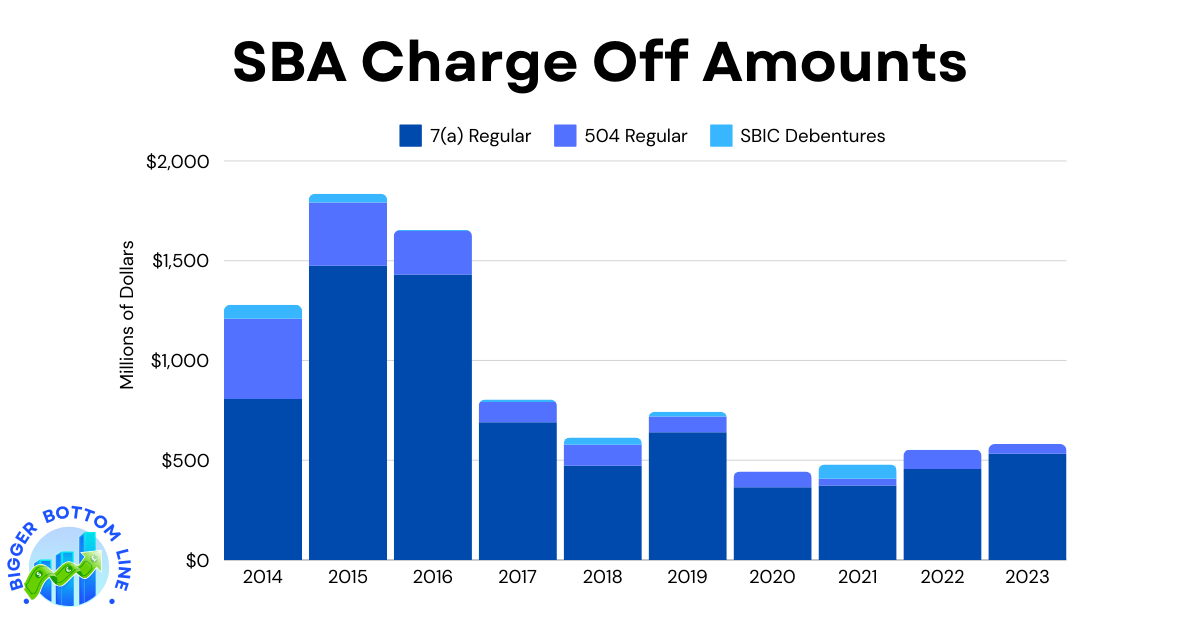
The Small Business Administration’s charge-off data from 2014 to 2023 reveals interesting trends across its three main lending programs. The 7(a) Regular program, which is SBA’s primary lending program, showed the highest charge-off amounts throughout the period, peaking at $1,475 million in 2015 before experiencing a general downward trend. The most dramatic decrease occurred between 2016 and 2018, when charge-offs dropped from $1,431 million to $472 million.
The 504 Regular program, which provides long-term, fixed-rate financing for major assets, demonstrated a more consistent downward trend, starting at $402 million in 2014 and declining to $49 million by 2023. The SBIC Debentures program showed the lowest overall charge-off amounts, fluctuating between $0 and $72 million, with notable spikes in 2014 ($70 million) and 2021 ($72 million). Interestingly, all three programs showed relatively lower charge-off amounts in recent years, particularly during and after the COVID-19 pandemic period of 2020-2021, possibly reflecting more conservative lending practices or improved economic conditions for small businesses.